Previous
Previous
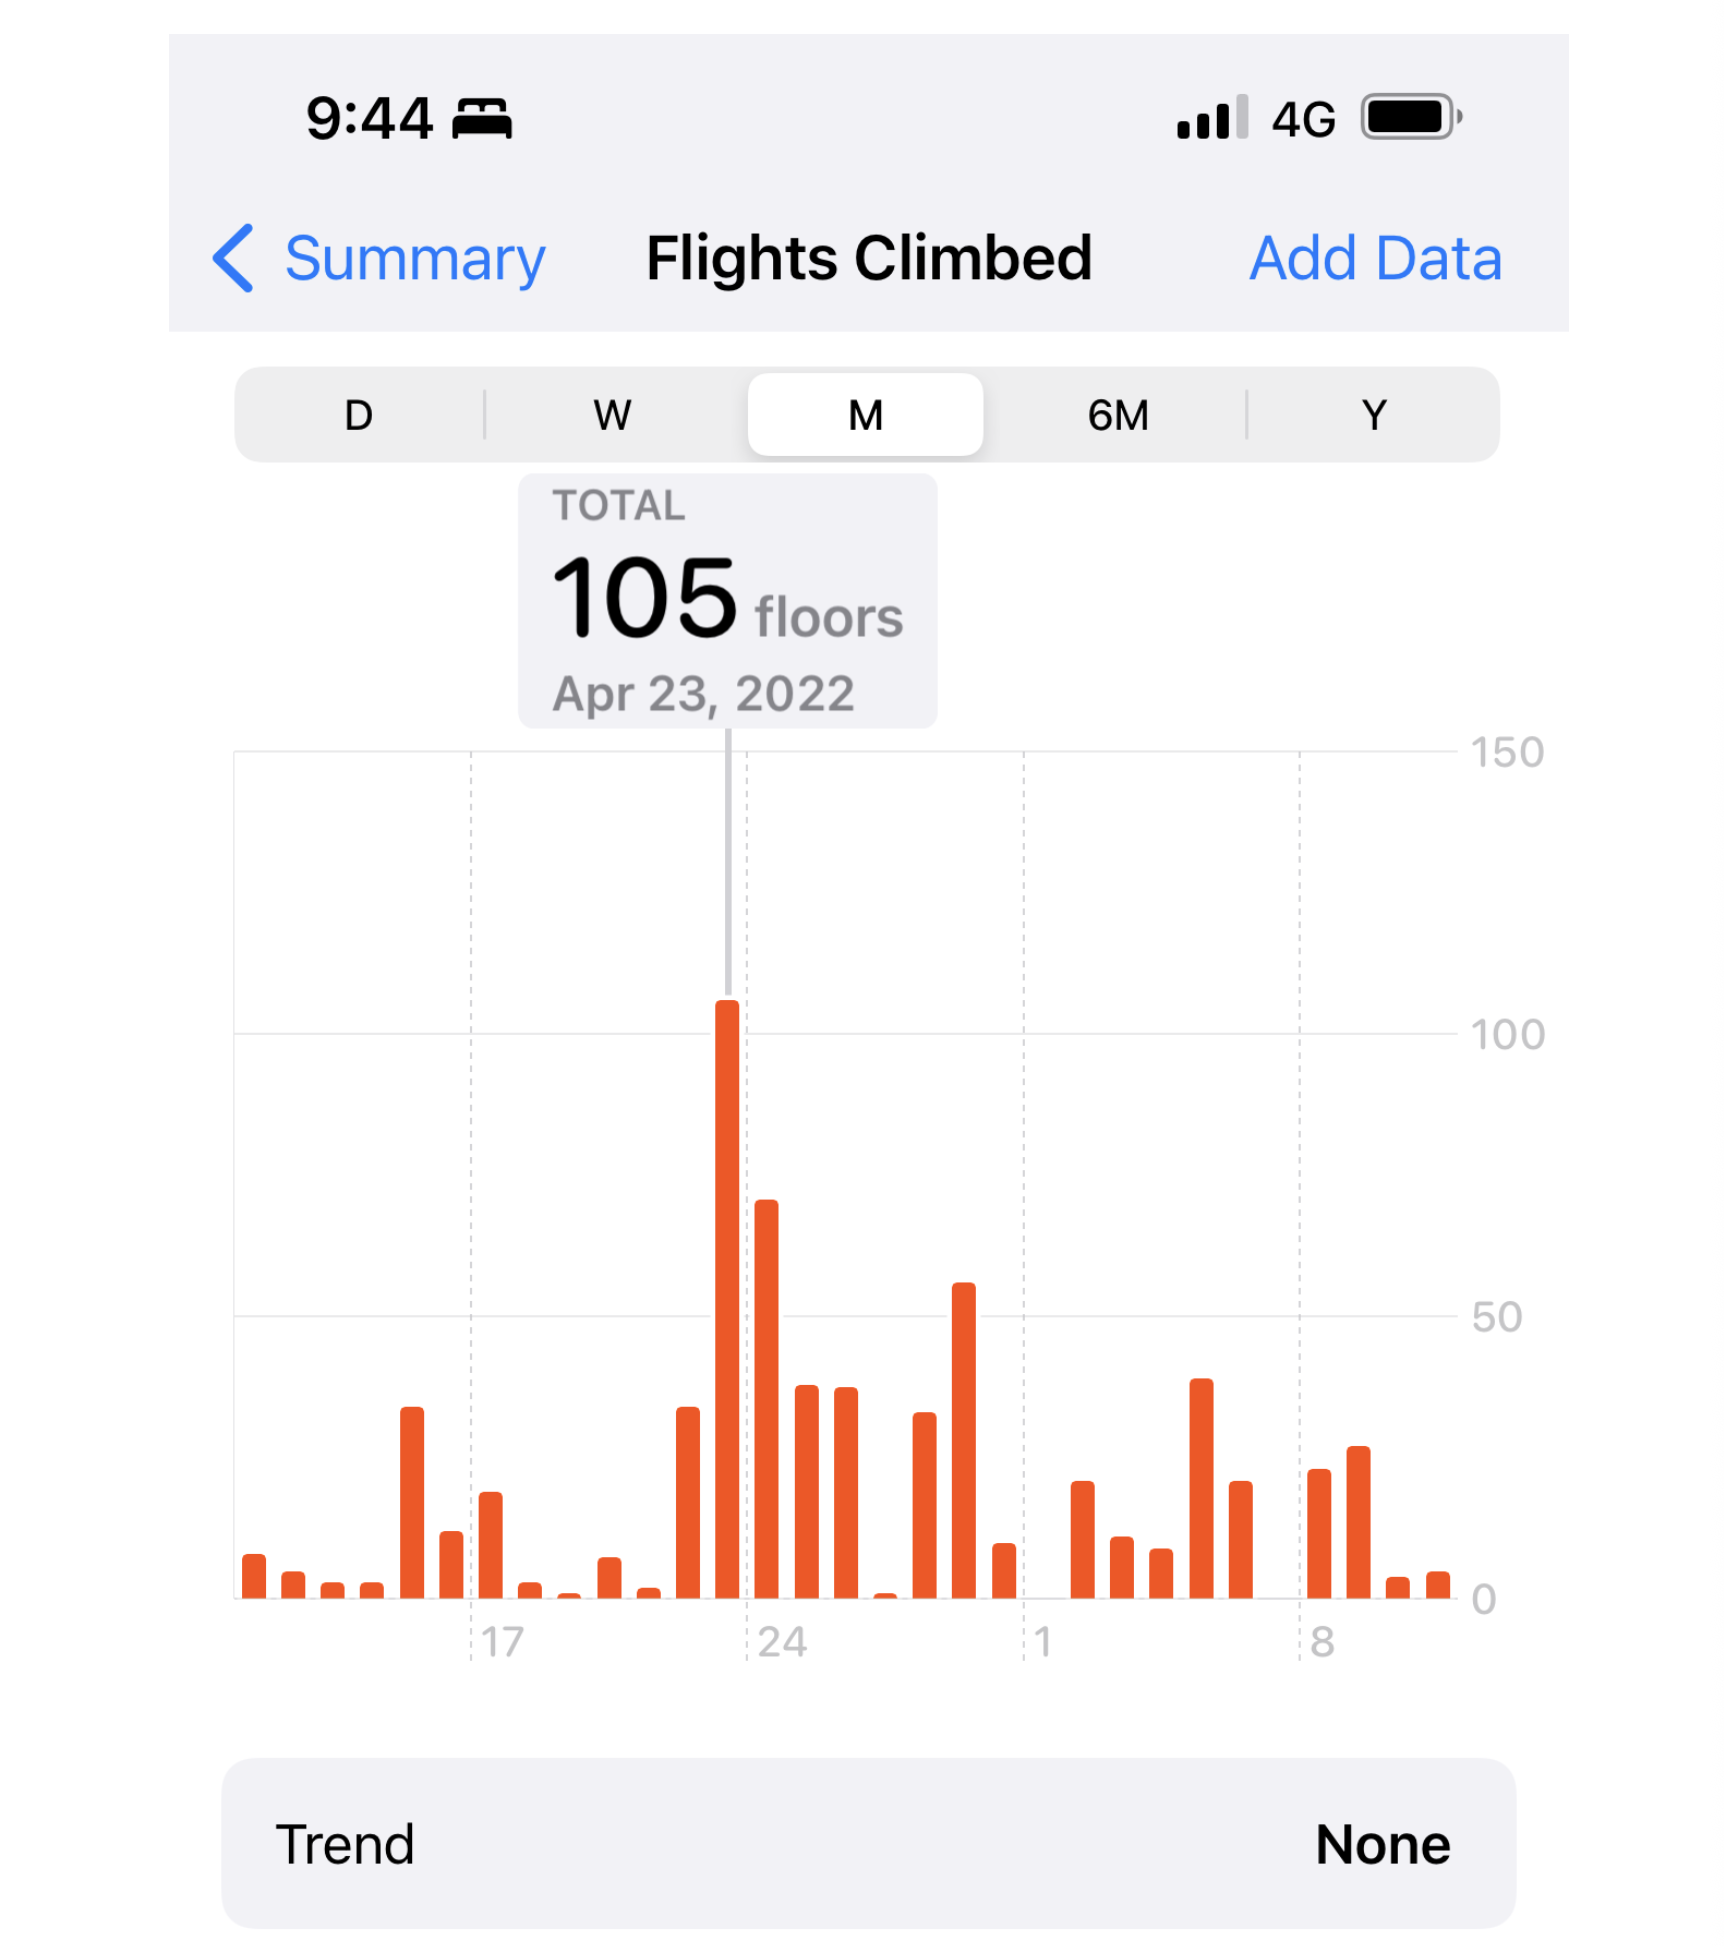
One last fun statistic
Next
Next
This chart shows the equivalent floors I climbed each day in the past month, so again same x axis as the other two graphs. Note April 23rd was my first day climbing across the Pyrenees, so hardest day was the first in terms of elevation gain.