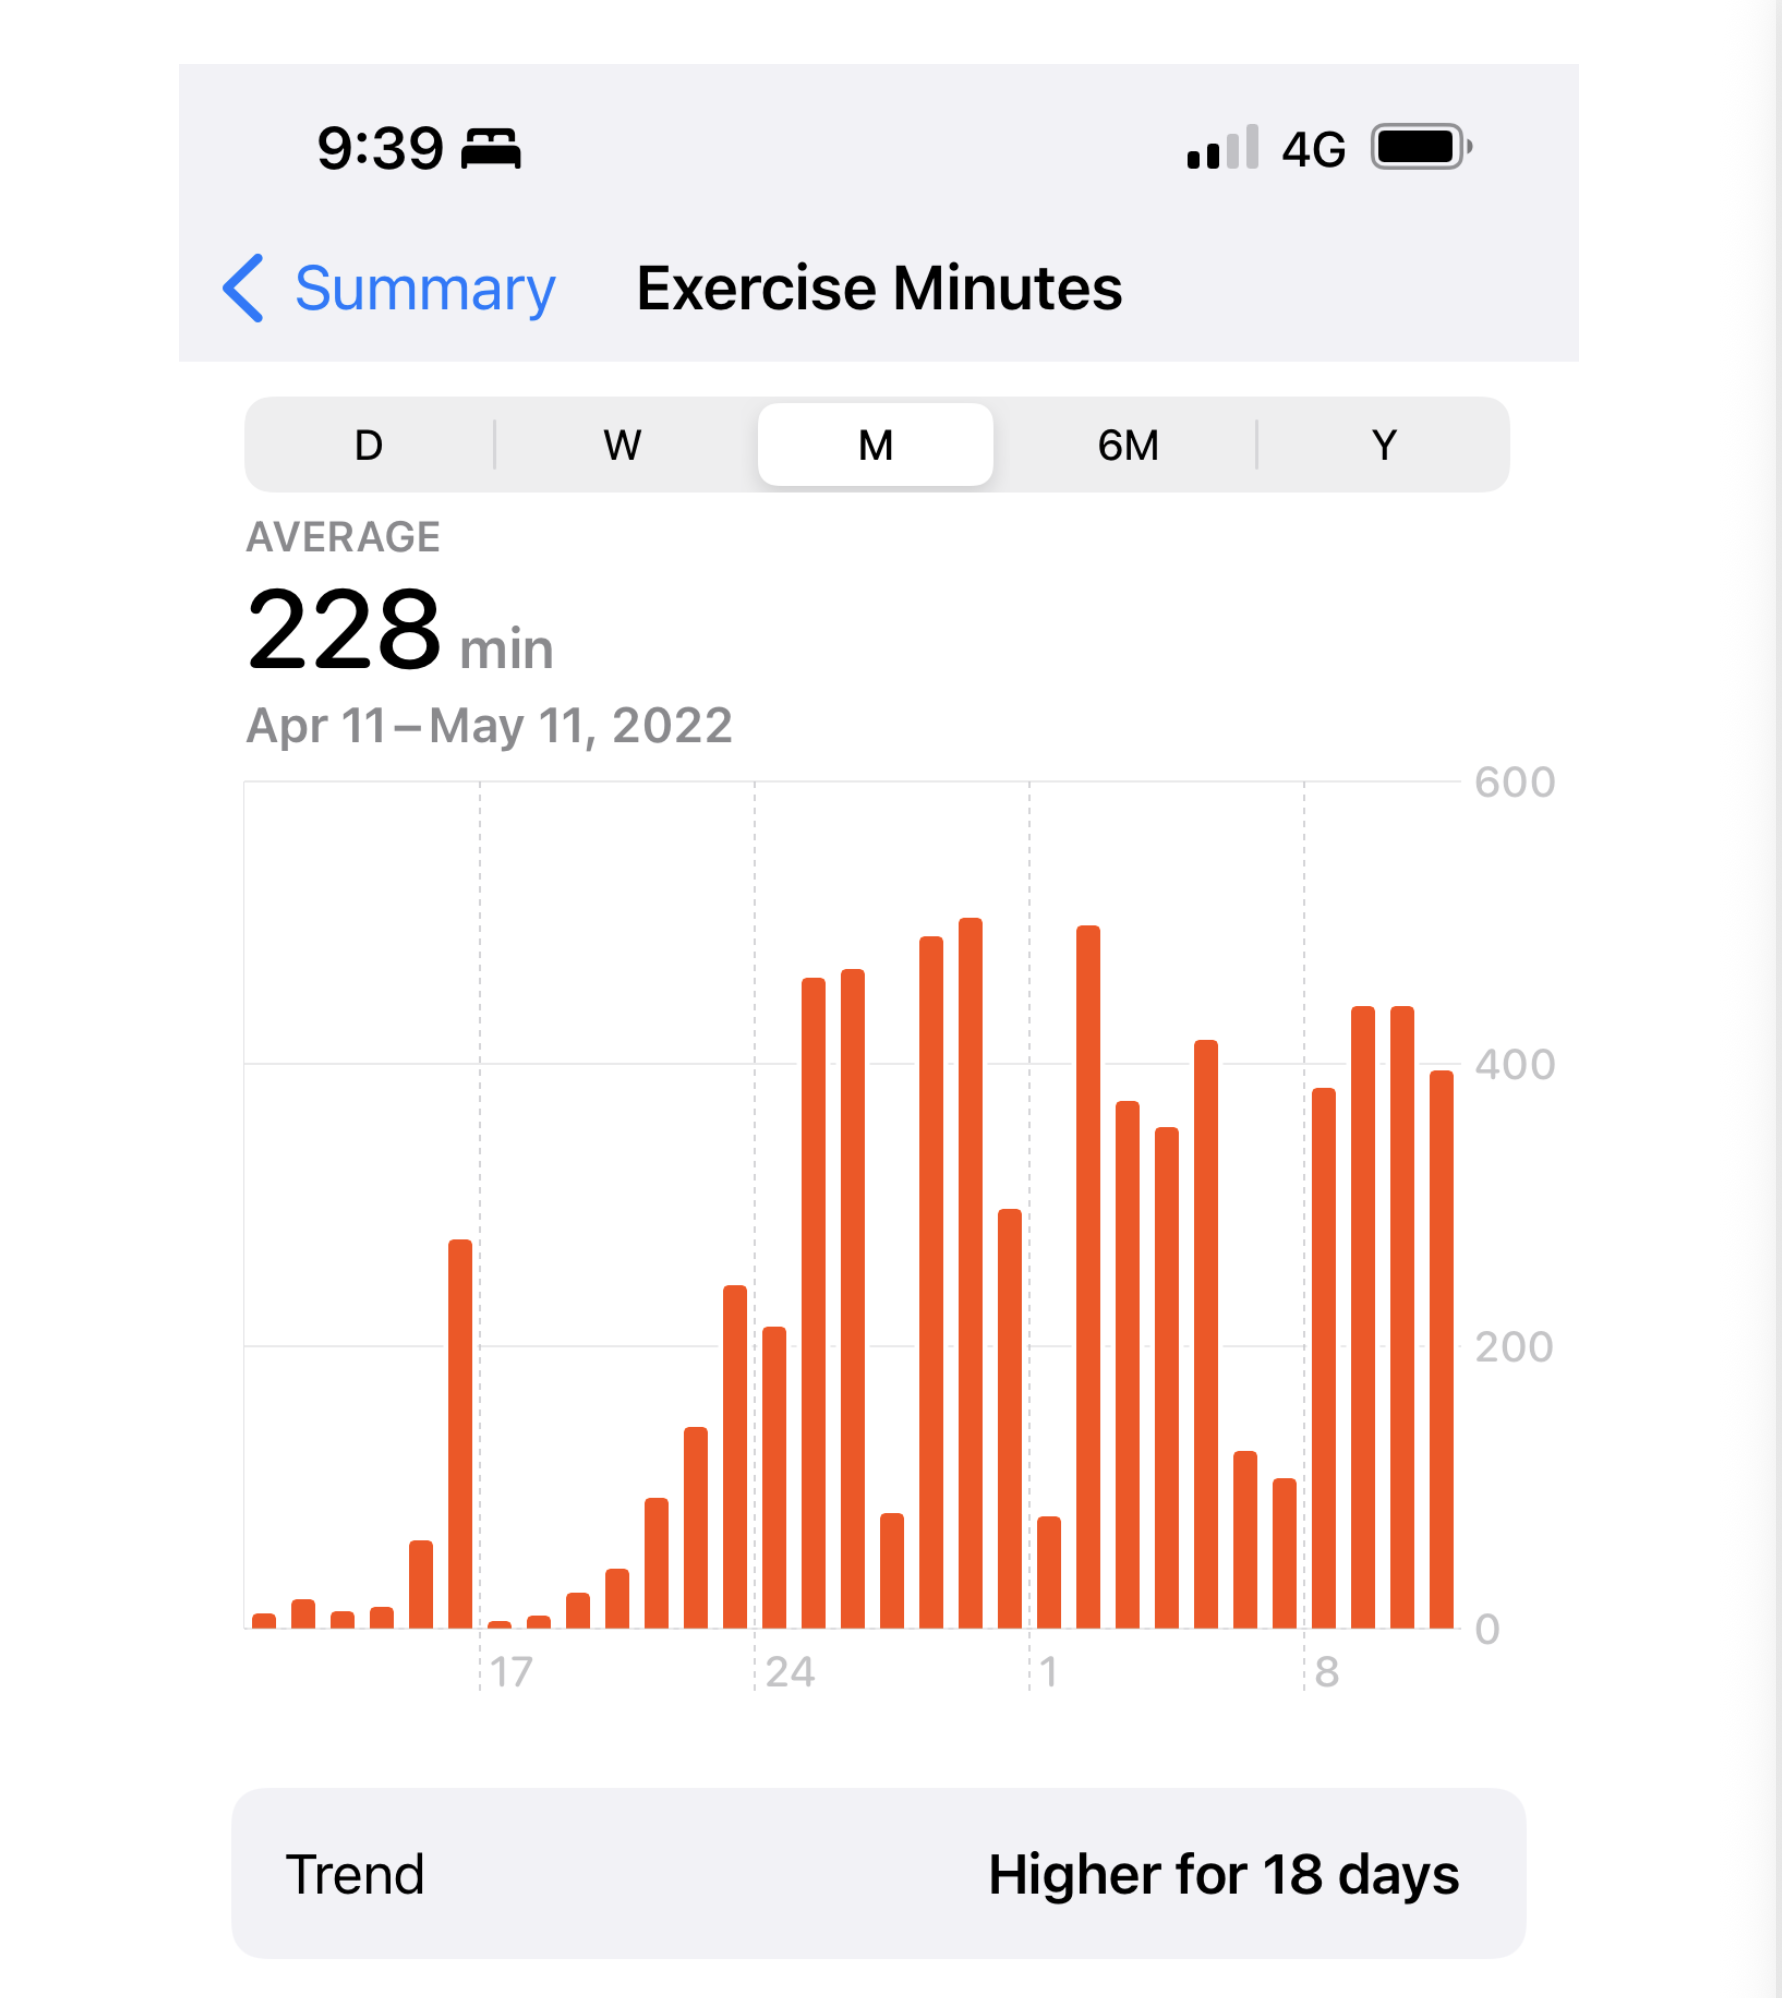
More fun statistics May 11 Written By Carlos Fox This graph shows my exercise minutes for the past month. So same x axis as the last graph. Carlos Fox
More fun statistics May 11 Written By Carlos Fox This graph shows my exercise minutes for the past month. So same x axis as the last graph. Carlos Fox